
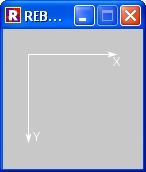
First of all you must know that in all programming languages coordinates on windows are to the right and to the bottom like this:
First of all we must have some data to display
my-data: [ 10 20 30 40 50 200 190 220 60 150 ]
then we must give a sequence to these data, making them pair data to plot on the graph:
tempg:   [ 0x0 ]

temp: 0

foreach item my-data [

       temp: temp + 10

       append tempg (as-pair temp item)

       ]
then we can use the grid effect to a 300x300 box. After the grid command you put the distance of the x and y grid and the offset (put always 0x0):

my-data: [10 20    30 40 50 200 190 220 60 150 ]

tempg:    [0x0]

temp: 0

foreach item my-data [

       temp: temp + 10

       append tempg (as-pair temp item)

       ]

lay:    compose/deep [box 300x300 effect [grid 10x10 0x0 draw [pen red    LINE-WIDTH 3    line (tempg) ] flip 0x1    ] ]

view layout [

       title "My graph"

       panel lay ;tricky!!!

        ]
You can add any DRAW effect to your graph: arrows, spline or whatever you wish:


If you need more complex graph, you can use the q-plot library; you can download the library from here: http://www.rebol.org/view-script.r?script=q-plot.r
There is a fantastic guide here: http://www.rebol.org/view-script.r?script=ez-plot.r
I just upload here some examples:


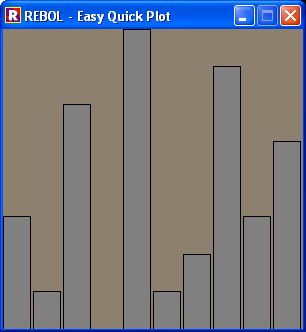


No comments:
Post a Comment